Generating Test Data
August 08, 2025
I’m writing this blog to learn about time series, programming in Python and Rust and database architecture. In this post, I want to get started with generating time series data.
What is a time series? Simply put, a time series is a sequence of data points indexed in time order. You encounter time series data every day — think of sensor measurements, sales data, stock prices, and weather forecasts.
The goal is to get a feel for what time series data looks like, what types of time series there are, what some properties are, and how to generate realistic looking fake data. Having test data with known properties will be extremely useful for testing and benchmarking time series databases.
A time series
A time series is a sequence of data points indexed in time order
What does this mean?
A data point in a time series is typically a timestamp and a value. The timestamp indicates the order, and the value is a measurement at given time. The value is typically a real-valued number. But it can also be a string, a boolean, or a more complex data type.
Commonly, a time series is an unbounded sequence. New data points arrive continuously.
There is an order, so each data point has a relation in time compared to the others. This relation between points is important. Commonly, one value and the neighboring values are closely related. Also, typically queries on time series data take this relationship over time into account. For example, comparing the rate of change, or grouping data points into time windows.
A time series measures the change over time
This has two important implications:
- Ordered data points: A data point is related to the one preceding and following it. This is different from a regular table, where the order of rows is not important.
- Historical context: This is different from a regular table, where we only have a snapshot of the data at a given time. Meaning that at any point in time we can compare a value to its previous values.
Generating time series data
Let us dive into some examples of time series to get a feel for them.
In this post, we’ll start with some simple, random time series. Each time series is generated by assigning a random value at each time step.
Although these time series lack real-world meaning, they are easy to generate and can sometimes be visually appealing. Furthermore, they are an extreme test for compression algorithms. Because there is no inherent structure, and compression exploits some inherent structure in the data to represent it more efficiently.
Also note that a truly random time series violates our two implications. The order doesn’t really matter since values are generated at random. Except for the random generator, there is no relation between consecutive values. Additionally, for the same reason, the history is not a context.
A Python CLI tool
The goal is to write a Python CLI tool that can generate time series data and
write it out to different file formats. The library will be called tsgen and
allows us to generate various types time series data for testing.
The code
repository of tsgen can be found here.
Generating timestamps
A first step to creating a time series, is generating a set of timestamps.
Often, we’ll see that time series are sampled or interpolated at regular intervals. For example, a sensor might measure a value every second. In that case, timestamps aren’t really necessary, given that we have the start date and the sampling frequency. The timestamps can always be reconstructed from those facts.
However, sometimes the sampling frequency is not constant. For example, a sensor might be turned off for a while. Or, the sampling happens on the occurrence of an event. Often, time series data is compressed. The best form of compression is not storing data points at all.
In tsgen we will allow both types of time series to be generated.
One way to generate timestamps would be to iterate in a while-loop:
1
2
3
4
5
6
7
8
9
10
11
12
13
14
15
16
17
18
19
20
21
def generate_timestamps(start_date, end_date, time_step, jitter):
    """
    Generates a list of timestamps between a start and end date.

    Args:
        start_date (datetime.datetime): The start date.
        end_date (datetime.datetime): The end date.
        time_step (int): The base time step in seconds.
        jitter (int): The maximum jitter in seconds.

    Returns:
        list: A list of datetime objects.
    """
    timestamps = []
    current_time = start_date
    while current_time <= end_date:
        timestamps.append(current_time)
        # Add jitter to the time step
        step = time_step + np.random.randint(-jitter, jitter + 1)
        current_time += pd.to_timedelta(step, unit="s")
    return timestamps
Random time series
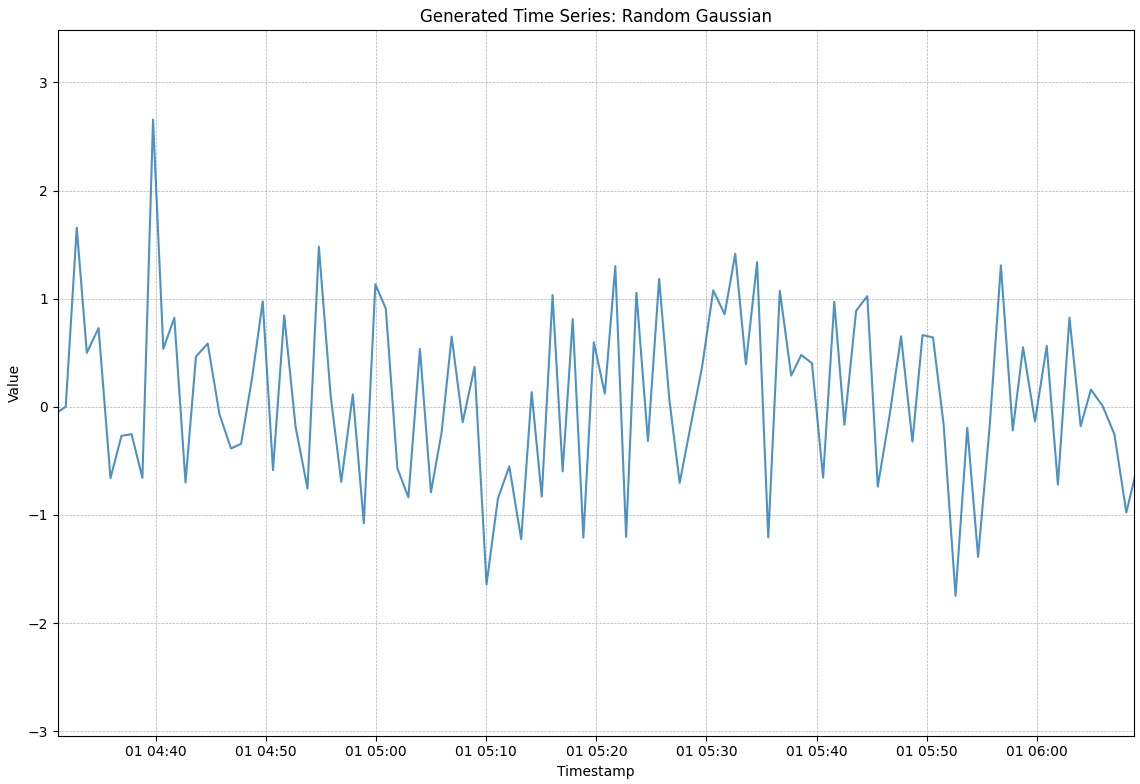
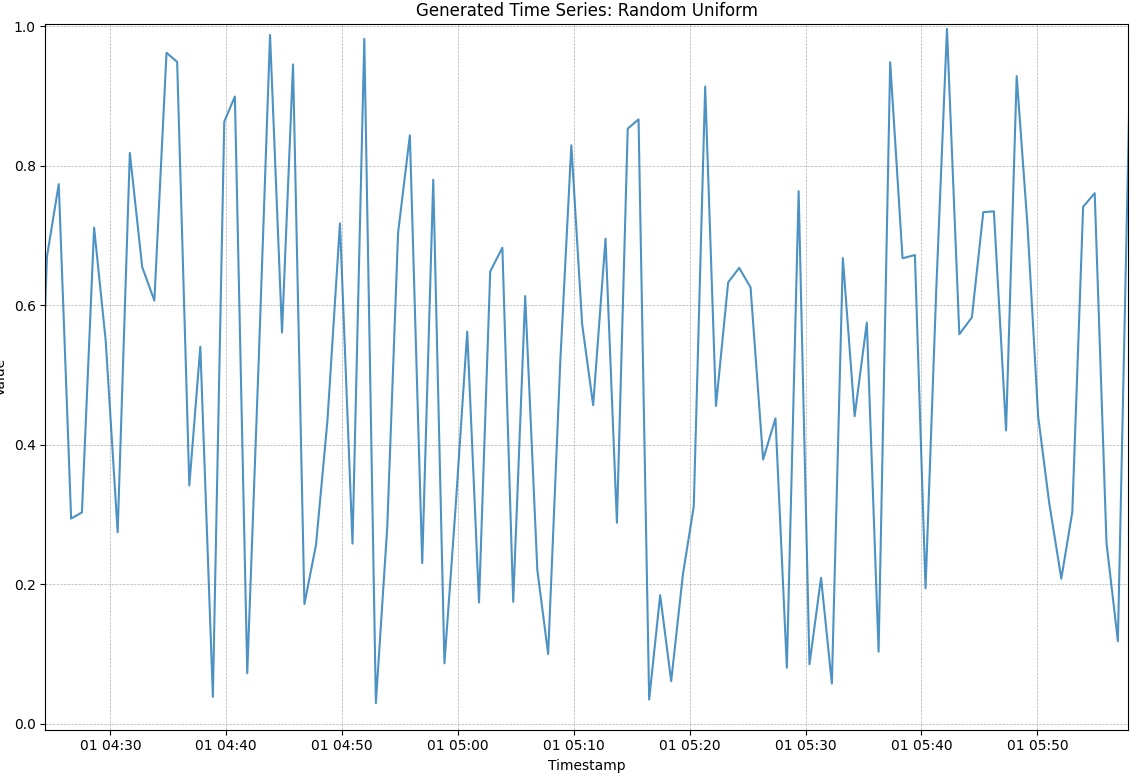
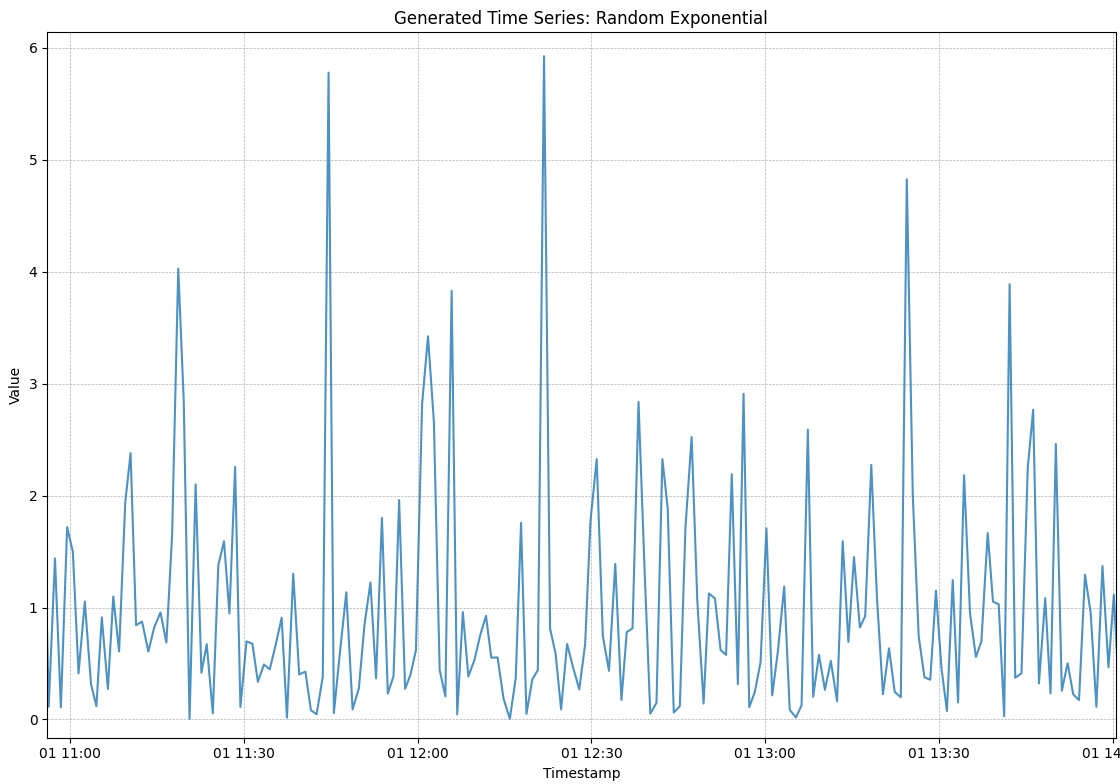
With the timestamps generated, it is relatively simple to generate the random values. There are many types of random distributions that can be used. We’ll be looking at the Gaussian, Uniform and Exponential distributions:
1
2
3
4
5
6
7
8
9
10
11
12
13
14
15
16
17
18
19
20
21
22
23
24
25
26
27
28
29
def _generate_random_series(start_date, end_date, time_step, jitter, random_func, name):
    timestamps = utils.generate_timestamps(start_date, end_date, time_step, jitter)
    n_samples = len(timestamps)
    values = random_func(size=n_samples)

    metric_id = 1001
    data_df = pd.DataFrame(
        {"metric_id": metric_id, "timestamp": timestamps, "value": values}
    )

    return data_df


def generate_gaussian(start_date, end_date, time_step, jitter):
    return _generate_random_series(
        start_date, end_date, time_step, jitter, np.random.normal
    )


def generate_uniform(start_date, end_date, time_step, jitter):
    return _generate_random_series(
        start_date, end_date, time_step, jitter, np.random.uniform
    )


def generate_exponential(start_date, end_date, time_step, jitter):
    return _generate_random_series(
        start_date, end_date, time_step, jitter, np.random.exponential
    )
This generates a Pandas DataFrame with three columns. The metric_id column
contains the ID of the metric, the timestamp column contains the timestamp of
the metric, and the value column contains the value of the metric.
Some example time series that we can now generate:
This wraps up our first encounter with time series data. In the next posts, we’ll explore some more (interesting) methods of generating time series data.